Pocket Option Indicators: Types, Strategies, and How to Use Them
This page explains the types of indicators available on Pocket Option and how to apply them effectively. You’ll learn how to identify market trends, measure momentum, track volatility, and combine tools to build your strategy. Each category has specific use cases depending on market behavior.
Indicators Content Overview
Types of Indicators Available on Pocket Option
Indicators on Pocket Option are grouped into four main categories. Each group serves a different purpose and helps traders make informed decisions.
Trend Indicators
Trend indicators show the general direction of the market. They help determine whether the price is moving up, down, or sideways.
- Moving Averages (SMA, EMA): Smooth out price data to reveal trend direction. EMA reacts faster to price changes, while SMA offers a more stable view.
- Alligator: Uses three moving averages with different periods to identify when a trend starts or ends.
- ADX: Measures the strength of a trend but doesn’t indicate direction.
- SuperTrend: Plots a dynamic trend line directly on the chart, changing color based on direction.
Momentum and Oscillator Indicators
These indicators measure how fast price moves and signal overbought or oversold conditions.
- RSI: Ranges from 0 to 100; values above 70 suggest overbought, below 30 indicate oversold.
- Stochastic Oscillator: Compares closing price to a price range over time, often used for short-term reversals.
- MACD: Combines moving averages to identify trend and momentum shifts.
- Momentum: Measures the rate of price change, highlighting acceleration or loss of strength.
- CCI: Identifies overbought/oversold zones relative to a moving average.
Volatility Indicators
Volatility indicators help gauge how much price moves within a certain period. They’re useful for breakout and reversal strategies.
- Bollinger Bands: Use standard deviations around a moving average to show price extremes.
- ATR: Shows average price range over a set period, helping estimate stop-loss and profit targets.
- Keltner Channel: Similar to Bollinger Bands, but based on ATR instead of standard deviation.
Volume and Market Strength Indicators
These tools measure how much market activity supports price moves.
- Awesome Oscillator: Highlights momentum based on recent price bars.
- Bulls/Bears Power: Separate indicators that measure the strength of buyers and sellers.
- Vortex: Tracks positive and negative movement to identify the beginning of new trends.
How to Add and Customize Indicators on Pocket Option
Pocket Option provides a built-in panel for adding indicators on both desktop and mobile. Users can adjust each tool to match their trading strategy.

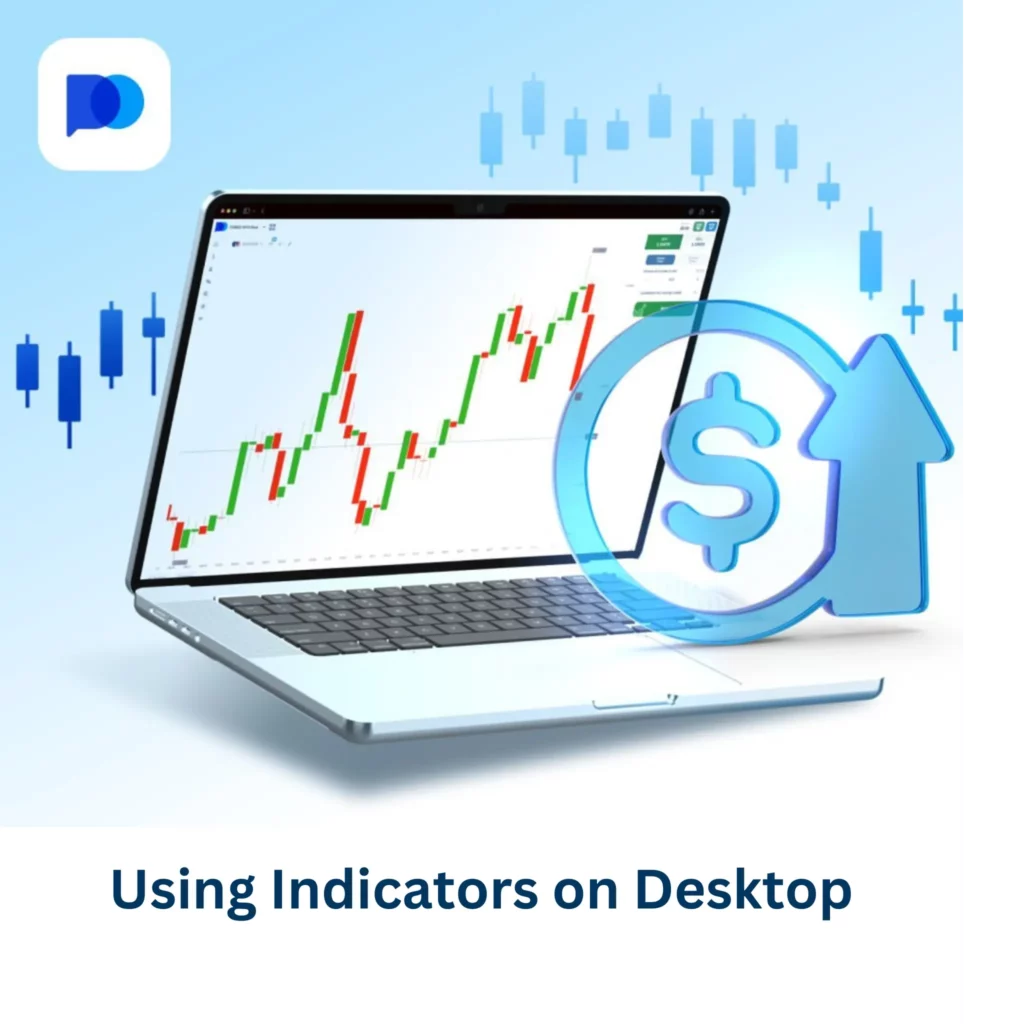
Using Indicators on Desktop
To add indicators on the desktop platform:
- Open the trading chart.
- Click the “Indicators” icon at the top of the chart window.
- Browse or search by name, then click to add it.
- The indicator will appear on your chart immediately.
You can add multiple indicators at once and manage them from the same menu. Each active indicator is listed in a sidebar with quick access to settings and removal options.
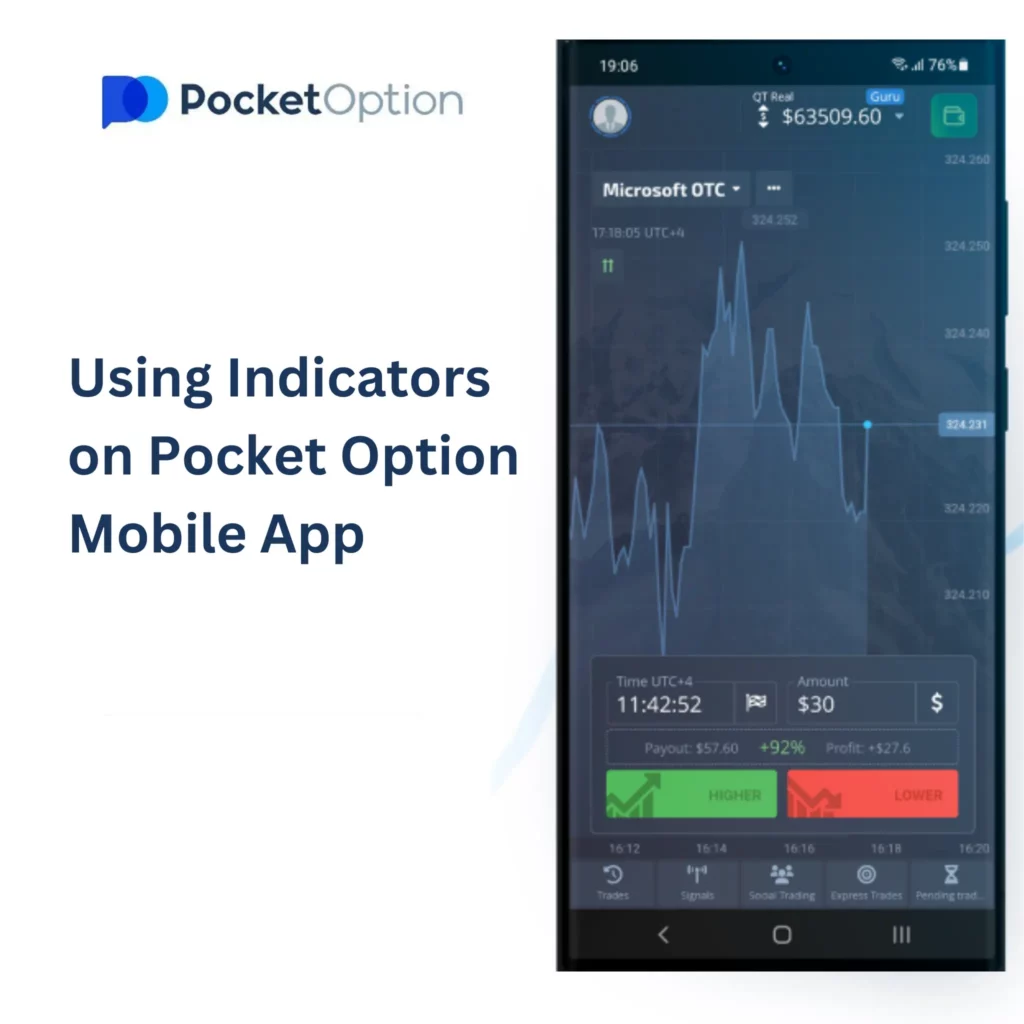
Using Indicators on Pocket Option Mobile App
On mobile devices:
- Launch the app and go to the trading interface.
- Tap the chart area to reveal the indicator icon.
- Tap the icon and select from the available indicators.
- Tap again to customize settings like period, style, and color.
Mobile layout is optimized for one-handed use, so all adjustments can be made in a few taps. Despite the smaller screen, most desktop indicators are also available in the app.


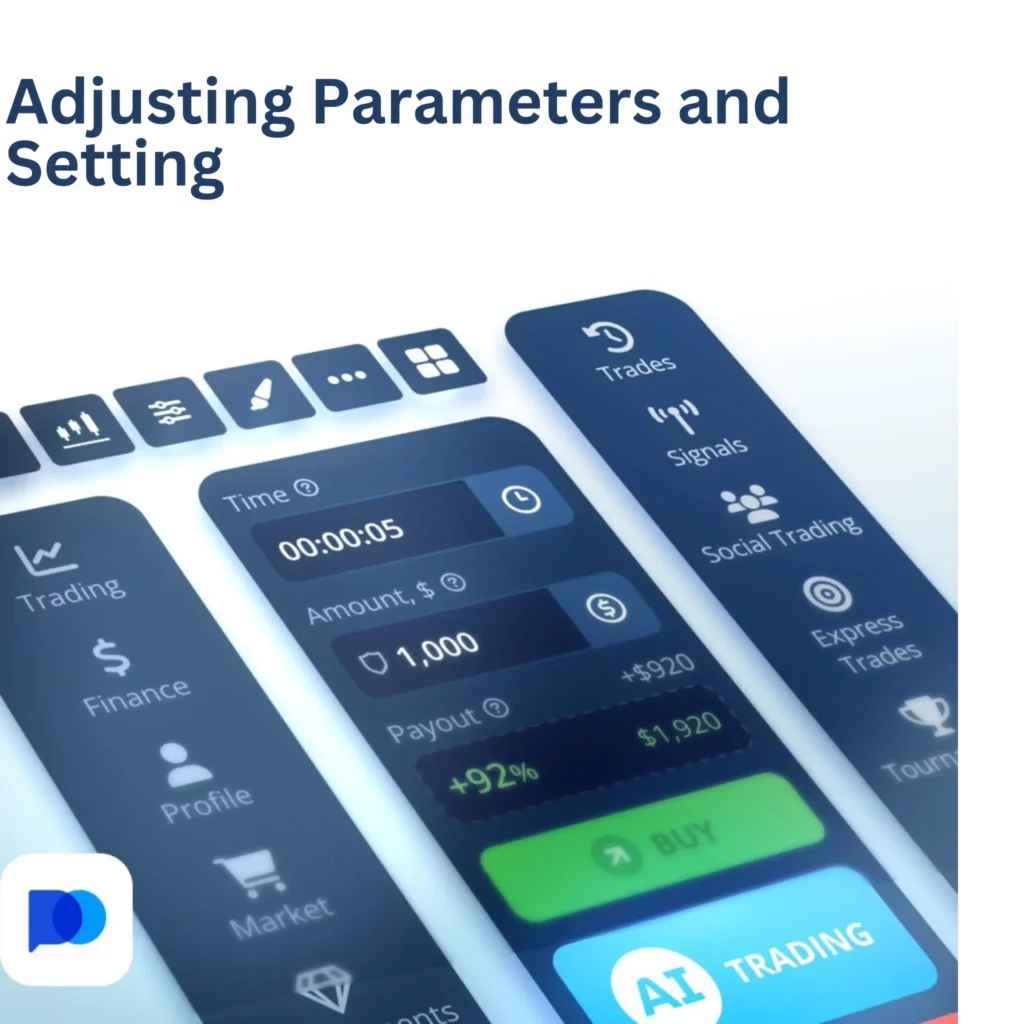
Adjusting Parameters and Settings
Each indicator has its own settings menu. You can modify:
- Period or calculation length
- Applied price (e.g. close, open, high, low)
- Line thickness and color for better chart visibility
For example, with RSI, you might change the period from 14 to 7 for faster signals. With Moving Averages, you can switch from SMA to EMA and select different periods for trend tracking.
Customized indicators help fine-tune your trading signals based on market conditions and personal preferences.
Combining Indicators for Better Accuracy
Using a single indicator may give limited insights. Combining two or more can improve precision and reduce false signals. The key is choosing tools that complement each other rather than repeat the same data.
Effective combinations usually involve tools from different categories. Here are some examples:
- RSI + Moving Average: RSI shows momentum; moving average filters for trend direction. Use RSI for entry and MA to stay with the trend.
- MACD + Bollinger Bands: MACD spots momentum shifts, while Bollinger Bands highlight breakout zones. Good for volatility-based setups.
- Stochastic + Support/Resistance Lines: Use Stochastic to spot reversals at key levels drawn manually on the chart.
These pairs help confirm signals and filter out noise in different market conditions.
Using too many indicators can create confusion. For example, two momentum tools might give opposite signals on the same chart. This happens because they’re measuring similar data in different ways.
To avoid conflict:
- Don’t use more than one indicator from the same category unless you’re comparing settings.
- Always test combinations on a demo account before applying them in live trading.
- Rely on price action or chart structure to confirm what the indicators suggest.
Clarity is more useful than quantity when building a strategy.
Pocket Option traders often rely on a few well-tested setups. Some of the most commonly used include:
- EMA (30) + MACD: Trend confirmation with MACD timing entry points
- Bollinger Bands + RSI: Reversal signals during overbought/oversold moves outside the bands
- SuperTrend + CCI: SuperTrend confirms trend direction, while CCI gives entry based on momentum shifts
These setups are simple to apply and provide clear visual signals on the chart.
Top Strategies Using Built-In Indicators
Pocket Option includes several indicators that support complete strategies. These setups help traders enter and exit with more confidence, especially when combined with basic chart analysis.
RSI Reversal Strategy
This strategy uses the Relative Strength Index to identify overbought or oversold conditions. When RSI crosses above 70, the asset may be overbought. When it falls below 30, it may be oversold.
Example approach:
- Look for RSI above 70 near a resistance level to consider a sell
- Look for RSI below 30 near a support zone to consider a buy
- Confirm with a candlestick reversal pattern if possible
This method works best in ranging or sideways markets.
MACD + EMA Trend Strategy
MACD helps spot momentum shifts, while the Exponential Moving Average (EMA) confirms trend direction. This combination suits trending markets.
How to use it:
- Apply MACD and a 30-period EMA to the chart
- Enter a buy when MACD crosses above its signal line and price is above EMA
- Enter a sell when MACD crosses below and price is under the EMA
Avoid this strategy during choppy or flat conditions.
Bollinger Band Breakout
This strategy targets sharp moves after periods of low volatility. Bollinger Bands help define the price range.
Steps:
- Wait for the bands to contract (narrow range)
- Enter a trade when the price breaks above or below the band
- Use ATR or recent candle size to estimate potential range
This setup is useful around news events or during market opening hours.
Stochastic + Support/Resistance Zones
The Stochastic Oscillator works well with manual support/resistance levels drawn on the chart. It gives clear overbought/oversold signals.
Example:
- Wait for price to reach a known support or resistance level
- Look for Stochastic to cross under 20 (buy) or over 80 (sell)
- Confirm with a rejection candle or price stall at the level
This strategy focuses on timing reversals with reduced risk.
Tips for Using Indicators on Pocket Option
Indicators are tools—not guarantees. They work best when used with discipline and a clear approach. These tips help avoid common mistakes and improve results.
Using too many indicators can lead to mixed signals and slower decisions. One trend tool and one momentum or volatility indicator are usually enough. Keep your setup simple so you can read signals quickly and stay focused.
Indicators should support your chart analysis, not replace it. Look at candlestick patterns, support and resistance levels, and trend lines alongside your indicators. This combination helps confirm entries and avoid weak signals.
Before trading with real money, try your indicator setup on a demo account. This lets you see how it performs in different conditions without risk. Make adjustments based on what works, then apply it with real funds once you’re confident.
Frequently Asked Questions (FAQ)
Which indicators are best for beginners?
Simple tools like Moving Averages, RSI, and Bollinger Bands are easy to understand and widely used. They offer clear signals without overwhelming the chart.
Can I use multiple indicators at the same time?
Yes, but it’s best to combine different types—for example, one trend indicator and one momentum tool. Too many can cause confusion or signal conflict.
Are Pocket Option indicators available on mobile?
Most indicators are available in the mobile app. You can add, adjust, and remove them directly from the trading screen.
What’s the difference between trend and momentum indicators?
Trend indicators show the overall direction of the market. Momentum indicators measure how fast the price is moving and help spot reversals or entry points.
How do I reset or remove indicators?
On both desktop and mobile, open the indicator menu and use the trash icon or reset option to remove or return settings to default.
